Real User Monitoring (RUM) vs. Lighthouse: Why Lab Data Can Deceive You About SEO and User Experience
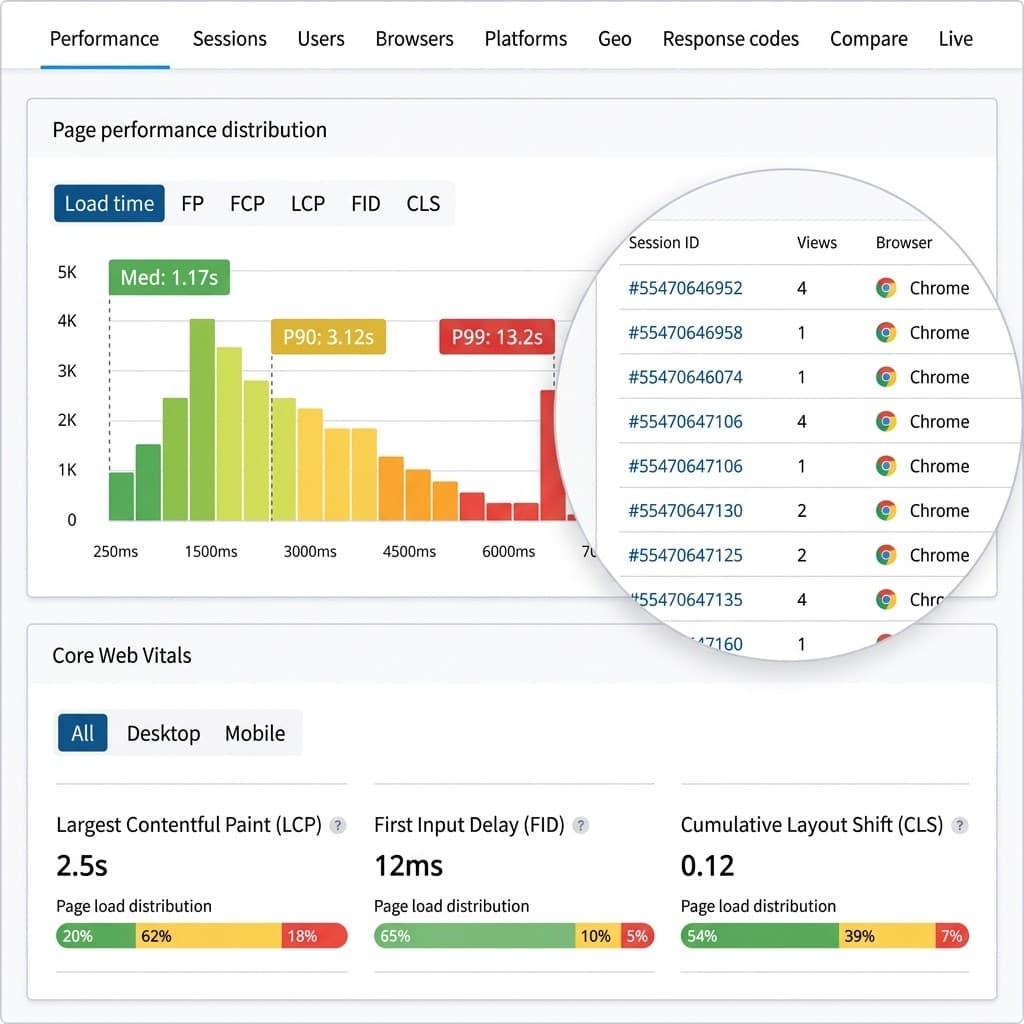
Lighthouse can award you a 95, 98, or even a perfect 100 score, yet a significant portion of your actual users might still be enduring a slow, unresponsive, or visually unstable experience.
The problem isn't necessarily with Lighthouse itself.
The problem lies in assuming that a single laboratory test accurately represents all of your users.
A synthetic test loads a page under strictly predetermined conditions: a simulated device, a throttled network profile, an empty or predictable cache state, and an automated, scripted journey. A real human visitor, on the other hand, might land on your site from a budget smartphone over a congested mobile network, from another city or continent, with browser extensions running, on a different rendering engine, facing a cookie consent banner, and executing dozens of spontaneous interactions that an automated test will never trigger.
That is why, when discussing Core Web Vitals, technical SEO, and user experience, we must differentiate between three distinct concepts:
- ◆Lab data: synthetic tests such as Lighthouse.
- ◆Field data: real user telemetry, such as the dataset gathered by CrUX.
- ◆RUM (Real User Monitoring): first-party instrumentation designed to capture, segment, and analyze real user behavior.
Understanding this fundamental difference can completely transform how you diagnose and optimize web performance.
Lighthouse Isn't Lying. It's Answering a Different Question
Before demonizing Lighthouse, let's establish one crucial fact.
Lighthouse is an exceptional tool.
The issue arises when we rely on its results to answer a question it was never designed to address.
Lighthouse attempts to answer:
How would this web page perform under these specific, controlled test conditions?
Field data answers:
How did this web page actually perform for the real humans who visited it?
These are two entirely different questions.
Lighthouse is remarkably effective during local development, staging environments, and debugging workflows. It enables engineers to spot bloated assets, render-blocking resources, costly JavaScript execution, unoptimized images, accessibility pitfalls, and dozens of low-hanging optimization opportunities.
Furthermore, a lab test is deterministic and reproducible. You can refactor code, rerun the audit, and evaluate the delta under identical conditions.
That repeatability is invaluable during engineering.
However, a production website never has just one user profile.
It faces thousands of permutations across:
- ◆device form factors and chipsets;
- ◆browsers and rendering engines;
- ◆operating systems;
- ◆network bandwidths and latencies;
- ◆geographical locations and edge CDNs;
- ◆screen viewports;
- ◆available CPU and RAM headroom;
- ◆cold vs. warm cache states;
- ◆browser extensions;
- ◆content blockers;
- ◆non-linear user interactions;
- ◆third-party tag behavior;
- ◆and dynamic network throttling.
A single synthetic run simply cannot capture that entire distribution.
Lab Data vs. Field Data
The core contrast can be summarized as follows:
| Characteristic | Lighthouse / Lab | RUM / Field |
|---|---|---|
| Real Users | ❌ | ✅ |
| Controlled Environment | ✅ | ❌ |
| Reproducibility | ✅ | Variable |
| Real Hardware | ❌ Simulated | ✅ |
| Real Networks | ❌ Throttled | ✅ |
| Real Geography | ❌ | ✅ |
| Real User Interactions | Limited | ✅ |
| Real INP Measurement | ❌ | ✅ |
| Development Debugging | Excellent | Good |
| Continuous Monitoring | No (ad-hoc) | ✅ |
| Real Regression Detection | Limited | ✅ |
| Data Used by CrUX | ❌ | Not directly |
| Technical SEO Value | High | Very High |
Google explicitly differentiates between lab measurements and field measurements. Core Web Vitals are, first and foremost, field metrics, and Google's ranking systems assess whether a page meets the thresholds at the 75th percentile (P75) of real page loads, segmented by device class.
Core Web Vitals Are Measured on Real Users
Today, the primary Core Web Vitals are:
LCP — Largest Contentful Paint
Measures when the primary viewport content element finishes rendering.
The recommended threshold is:
LCP ≤ 2.5 seconds
INP — Interaction to Next Paint
Measures interface responsiveness to user interactions throughout the full lifespan of the page.
The recommended threshold is:
INP ≤ 200 ms
CLS — Cumulative Layout Shift
Measures visual stability and unexpected layout shifting.
The recommended threshold is:
CLS ≤ 0.1
These values are evaluated at the 75th percentile of collected field experiences.
Herein lies the critical discrepancy.
A Lighthouse report might proudly display:
LCP: 1.8 s
That does not mean that 75% of your real visitors experience an LCP of 1.8 seconds.
In reality, your distribution could easily look like this:
- ◆desktop broadband visitors: 1.4 s;
- ◆high-end mobile devices: 2.0 s;
- ◆mid-range mobile devices: 3.1 s;
- ◆congested mobile connections: 4.2 s.
The cognitive shortcut of looking at a single lab score completely obscures this variance.
Why the 75th Percentile Matters More Than Your Best Score
One of the most pervasive traps in web performance is fixating on best-case scenarios.
Core Web Vitals do not ask:
How fast can my website theoretically load?
They ask:
What level of performance does a representative majority of my audience actually experience?
This is why Google relies on the 75th percentile (P75).
Imagine 100 visits sorted in ascending order of LCP.
If the 75th visit clocks in at 3.2 seconds, then your P75 is approximately 3.2 s.
Even if you have numerous visits recording:
- ◆1.2 s;
- ◆1.5 s;
- ◆1.8 s;
- ◆2.0 s;
your site still fails the Core Web Vitals threshold if the slower 25% drags the P75 benchmark above 2.5 seconds.
This explains why an internal development team with high-end laptops and gigabit fiber perceives a website as blazing fast, while real customers experience sluggishness and Google Search Console flags failing Core Web Vitals.
The Particularly Tricky Case of INP
The gulf between laboratory simulations and real field data becomes glaringly obvious with Interaction to Next Paint (INP).
INP measures genuine user interactions.
A real human visitor might:
- 1.open the mobile navigation drawer;
- 2.expand a multi-faceted filter;
- 3.dismiss a consent modal;
- 4.trigger a quick-view modal;
- 5.add an item to the cart;
- 6.fill out an address form;
- 7.toggle a product variant switch;
- 8.perform an instant autocomplete search.
Lighthouse cannot spontaneously emulate this continuous, unpredictable interaction journey.
Because of this limitation, Lighthouse does not measure INP as a lab metric. Instead, it relies on Total Blocking Time (TBT) as a proxy metric for main-thread responsiveness during initial page load. However, TBT and INP are fundamentally different metrics measuring different phases of execution.
This frequently creates a baffling situation:
Lighthouse displays a near-zero TBT, yet real visitors suffer from failing INP scores.
Why?
Because the interaction bottleneck almost always occurs long after the initial load has completed.
Consider an e-commerce platform where clicking the “Add to Cart” button fires client-side validation, complex state management, analytics dispatchers, and third-party trackers that lock the main thread for 600 ms.
A synthetic Lighthouse run that never triggers that button will never uncover the freeze.
A RUM setup will catch it immediately.
Real user telemetry can reveal actionable diagnostic insights:
INP P75: 420 ms
Problematic Interaction:
"Add to Cart"
Target Element:
<button class="add-to-cart">
Frequency:
18.4% of all mobile sessions
Now you have an actionable technical diagnosis.
You are no longer asking:
“Why is our sitewide INP failing?”
You are asking:
“Why does clicking this specific button block the main thread for 400ms+?”
That shift in perspective is monumental.
CLS: The Problem That Surfaces While Browsing
Cumulative Layout Shift behaves in a similar fashion.
A synthetic lab audit can catch layout shifts that happen during the initial paint cycle, but real users experience jarring shifts as they scroll and interact.
Typical post-load culprits include:
- ◆lazy-loaded images injected without explicit width and height dimensions;
- ◆programmatic ad slots injected dynamically into view;
- ◆iframes and embeds resizing unpredictably;
- ◆delayed cookie banners popping onto the viewport;
- ◆hydration discrepancies in client-rendered components;
- ◆web fonts loading late and triggering severe FOIT/FOUT re-layouts;
- ◆asynchronous API calls inserting DOM elements above existing reading material.
The consequence is a webpage that appears impeccably stable in a Lighthouse snapshot, yet constantly jumps under the fingers of real visitors.
Field monitoring tracks shifts across the entire session lifecycle, not just during the first few seconds of page delivery.
What Does Google Actually Use for SEO Rankings?
A crucial distinction must be drawn here.
Google does not take your Lighthouse performance score and feed it into its search ranking algorithm.
Nor does Google tap directly into your private first-party RUM database to calculate rankings.
Instead, Google evaluates Core Web Vitals using real-world field telemetry. Its authoritative public source is the Chrome User Experience Report (CrUX), which aggregates real user experiences from opted-in Chrome users across the globe. CrUX is the data feed powering PageSpeed Insights field sections and the Core Web Vitals reports in Google Search Console.
Therefore, the accurate workflow is:
Lighthouse
    ↓
Lab Testing & Diagnostics
    ↓
Detect & Debug Issues Locally
Whereas:
Real Users
    ↓
Field Telemetry
    ├── CrUX → Signals evaluated by Google's search algorithms
    └── First-Party RUM → Granular telemetry, alerting & root-cause analysis
A second vital reminder must be kept in mind:
Core Web Vitals are not the entirety of SEO.
Google rewards strong Core Web Vitals because they represent a friction-free page experience aligned with user satisfaction. However, a flawless Core Web Vitals score will never compensate for irrelevant content, thin authority, poor search intent matching, or broken crawlability. High-quality content, relevance, and solid technical foundations remain paramount.
CrUX Is Not the Same as First-Party RUM
If Lighthouse represents the lab, one might think we can simply rely on CrUX and discard everything else.
Not quite.
Both CrUX and RUM are field data, but they serve fundamentally different purposes.
CrUX is Google's aggregated Chrome user dataset. It is essential because it is the exact benchmark used for official search ranking evaluations.
However, CrUX has significant operational limitations:
- ◆it is strictly aggregated;
- ◆it is heavily anonymized;
- ◆it only covers eligible Chrome traffic;
- ◆it requires minimum traffic volume thresholds to generate data;
- ◆it lacks granular debugging dimensions.
First-party RUM, conversely, is code that you control directly on your application.
This allows you to slice and dice performance across custom dimensions:
URL
↓
/products/ptz-camera
Device Class
↓
Mobile
Country
↓
Argentina
Browser
↓
Chrome Mobile
Template
↓
Product Detail Page (PDP)
LCP P75
↓
3.4 s
INP P75
↓
280 ms
CLS P75
↓
0.18
Suddenly, you possess deep contextual telemetry to drive engineering decisions.
CrUX can notify you that an issue exists.
RUM pinpoints exactly where, why, and for whom it is happening.
Google's own performance advocacy team underscores that while CrUX provides the high-level macro view, only first-party RUM delivers the micro-telemetry required to rapidly diagnose regressions.
How to Implement Your Own RUM Setup
You don't necessarily need to deploy a complex enterprise observability platform to start gathering real telemetry.
Modern web browsers feature native APIs engineered to monitor performance events in real time.
The most foundational of these is:
PerformanceObserverWith PerformanceObserver, we can intercept performance timing entries produced by the browser engine:
const observer = new PerformanceObserver((list) => {
  for (const entry of list.getEntries()) {
    console.log(entry);
  }
});
observer.observe({
  type: 'largest-contentful-paint',
  buffered: true
});
This provides access to raw paint timings logged during a user session.
However, accounting for edge cases, visibility changes, iframe contexts, background tabs, and browser idiosyncrasies across all Core Web Vitals using raw PerformanceObserver instances is notoriously tricky.
Fortunately, there is an official, battle-tested solution.
web-vitals: The Standard Library for Real User Telemetry
GoogleChromeLabs actively maintains the open-source web-vitals library, specifically designed to capture Core Web Vitals on real devices using the identical measurement methodologies applied by Google's internal systems.
A standard implementation is remarkably clean:
import { onLCP, onINP, onCLS } from 'web-vitals';
onLCP(console.log);
onINP(console.log);
onCLS(console.log);
When a user browses the page, the callbacks emit structured metric payloads:
{
  name: "LCP",
  value: 2740,
  rating: "needs-improvement",
  id: "...",
  delta: 2740
}
Logging these values to the browser console is only step one.
The real power comes from streaming these payloads to your analytics or telemetry backend.
Transitioning From Measurement to True RUM
We can write a resilient telemetry dispatcher using the navigator.sendBeacon or fetch keepalive protocol:
function sendToAnalytics(metric) {
  fetch('/api/rum', {
    method: 'POST',
    body: JSON.stringify({
      name: metric.name,
      value: metric.value,
      rating: metric.rating,
      id: metric.id,
      url: location.href
    }),
    headers: {
      'Content-Type': 'application/json'
    },
    keepalive: true
  });
}
Then wire up the metrics:
import {
  onLCP,
  onINP,
  onCLS
} from 'web-vitals';
onLCP(sendToAnalytics);
onINP(sendToAnalytics);
onCLS(sendToAnalytics);
From that moment onward, every production visit generates real performance data.
Yet there is still one indispensable element needed:
contextualizing the telemetry.
The True ROI Lies in Segmentation
A single, global average is almost always misleading.
Suppose your dashboard reports:
LCP P75: 2.4 sOn paper, this appears safely under the 2.5s threshold.
Now segment that dataset:
| Segment | LCP P75 |
|---|---|
| Desktop | 1.5 s |
| Mobile | 3.1 s |
| Argentina | 2.1 s |
| Brazil | 2.8 s |
| Mexico | 3.0 s |
| Europe | 1.7 s |
A completely different reality emerges.
The problem is not “the entire site.”
The problem is:
the site for specific user cohorts, regions, or hardware configurations.
Recognizing this variance is crucial for international SEO, e-commerce stores, SaaS platforms, and digital publishers with diverse audiences.
What Dimensions Should a RUM Architecture Capture?
In addition to the raw metric timings, you should record environmental dimensions that provide operational context:
const rumData = {
  metric: metric.name,
  value: metric.value,
  url: location.href,
  device: /Mobi/i.test(navigator.userAgent)
    ? 'mobile'
    : 'desktop',
  language: navigator.language,
  viewport: {
    width: window.innerWidth,
    height: window.innerHeight
  },
  connection: navigator.connection?.effectiveType || null
};
Additional high-value dimensions include:
- ◆country or geographic region (where legally compliant);
- ◆page template / route layout;
- ◆browser and engine version;
- ◆operating system;
- ◆marketing campaign parameters;
- ◆application release version / Git commit hash;
- ◆session authentication state;
- ◆effective network round-trip time (RTT);
- ◆anonymized session identifier.
The golden rule remains:
collect only what is strictly necessary for technical observability and rigorously respect privacy standards (GDPR, LGPD, etc.).
RUM is not surveillance; it is technical telemetry to safeguard digital experience.
Device-Level P75: A Far More Honest Metric
Consider a project logging the following field data:
Desktop
LCP P75: 1.7 s
INP P75: 120 ms
CLS P75: 0.04
Mobile
LCP P75: 3.4 s
INP P75: 310 ms
CLS P75: 0.16
A developer running Lighthouse on a modern MacBook Pro over office Wi-Fi will likely report:
“We have a 95 Performance score.”
Yet the RUM telemetry warns:
“Our mobile visitors are having a degraded, frustrating experience.”
Given that mobile devices account for the lion's share of modern organic search traffic, this transforms from a technical nuance into a high-priority business risk.
Detecting Regional Performance Gaps
This segmentation is especially vital for global digital operations.
Suppose your telemetry indicates:
Spain
LCP P75: 1.9 s
Argentina
LCP P75: 2.8 s
Mexico
LCP P75: 3.2 s
Chile
LCP P75: 2.5 s
Now you can ask the right architectural questions:
What is driving these regional discrepancies?
Potential culprits include:
- ◆CDN edge cache hit ratios;
- ◆round-trip latency to the origin server;
- ◆Time to First Byte (TTFB) in specific geographic zones;
- ◆localized third-party tags (chat widgets, payment gateways);
- ◆unoptimized regional image assets;
- ◆web font fallback latencies;
- ◆third-party analytics scripts;
- ◆regional edge routing configurations.
Synthetic lab audits executed from a single server location will never expose these global variations.
A robust RUM system proves they exist.
RUM + Attribution: Uncovering the Root Cause
The web-vitals package provides an advanced attribution build that decorates metric events with rich diagnostic metadata explaining why an anomaly occurred:
import {
  onLCP,
  onINP,
  onCLS
} from 'web-vitals/attribution';
function sendMetric(metric) {
  console.log({
    name: metric.name,
    value: metric.value,
    attribution: metric.attribution
  });
}
onLCP(sendMetric);
onINP(sendMetric);
onCLS(sendMetric);
Attribution metadata links poor metrics directly to DOM nodes, selector paths, and execution contexts.
A diagnostic workflow can instantly trace:
Elevated INP
↓
Problematic Interaction
↓
"Add to Cart" button
↓
Heavy JavaScript handler
↓
Long Task execution
↓
Third-party tracking script
This is vastly more actionable than simply stating:
“Your INP is failing in the red zone.”
The Winning Triad: Lighthouse + RUM + CrUX
The takeaway is never to discard Lighthouse.
Doing so would be a serious engineering mistake.
The most effective strategy leverages each tool for what it does best:
1. Lighthouse → Prevent & Diagnose Locally
Deploy it throughout:
- ◆local development;
- ◆pull request CI/CD checks;
- ◆staging and QA audits;
- ◆architectural refactors;
- ◆asset optimization sprints;
- ◆bundle size auditing.
Its superpower is providing controlled, repeatable test environments.
2. RUM → Monitor Real-World Experiences
Deploy it in production to detect:
- ◆real-world performance regressions;
- ◆device-specific bottlenecks;
- ◆geographic and CDN latency gaps;
- ◆problematic page templates;
- ◆unhandled user interaction lags;
- ◆third-party tag disruptions.
It serves as your live experience observability system.
3. CrUX → Track Google's Evaluated Reality
CrUX serves as the official scorecard that Google uses to gauge your Core Web Vitals for search rankings.
However, keep in mind its defining characteristic:
CrUX is not real-time.
CrUX aggregates data over a rolling 28-day collection window. An optimization deployed this morning will take several weeks to fully reflect in Google Search Console or PageSpeed Insights.
This cadence creates a clear optimization loop:
Deploy Optimization
   ↓
RUM Telemetry
   ↓
Did the metric improve in the field?
   ↓
Yes
   ↓
Allow the 28-day window to mature
   ↓
CrUX
   ↓
Has Google registered the improvement?
RUM acts as your early warning radar, verifying fixes weeks before Google's public reports confirm them.
A Real-World Case Study
Consider an e-commerce brand rolling out a redesigned product page.
Lighthouse returns glowing scores:
Performance: 96
LCP: 1.8 s
TBT: 90 ms
CLS: 0.03
Everything looks ready for release.
Yet 24 hours after launch, production RUM flags:
Mobile
LCP P75: 3.0 s
INP P75: 380 ms
CLS P75: 0.17
Segmenting by route template reveals:
Homepage:
LCP 2.2 s
Category Pages:
LCP 2.5 s
Product Detail Pages:
LCP 3.6 s
INP 420 ms
Filtering further by interaction targets reveals:
Problematic INP Interactions:
1. Variant selector radio buttons
2. Image gallery slider
3. Add to Cart button
Deep-dive profiling reveals that a newly added recommendation widget was monopolizing the browser main thread during state re-renders.
Without RUM, the team would have celebrated their 96 Lighthouse score while customer abandonment quietly climbed.
With RUM, the engineering team isolated and resolved the bottleneck in hours.
How This Redefines Modern Technical SEO
Historically, a technical SEO audit focused predominantly on:
- ◆indexing status;
- ◆canonical tags;
- ◆XML sitemaps;
- ◆robots.txt rules;
- ◆site architecture;
- ◆internal linking equity;
- ◆meta tags;
- ◆Schema markup;
- ◆client-side rendering viability;
- ◆Core Web Vitals scores.
While those pillars remain mandatory, modern performance engineering requires an additional layer of rigor:
What actual experience are our visitors receiving on their personal devices?
An advanced technical audit must bridge:
SEO
+
Web Performance
+
User Experience (UX)
+
First-Party Field Data
For instance:
URL suffers an organic traffic dip
        ↓
Google Search Console
        ↓
Query shifts / CTR decay / ranking changes
        ↓
Core Web Vitals health
        ↓
RUM Telemetry
        ↓
Device segmentation
        ↓
Root-cause resolution
This does not mean automatically attributing every ranking fluctuation to Core Web Vitals.
That would be technically inaccurate.
It means integrating real-world experience telemetry as a fundamental variable in your diagnostic investigations.
The Trap of Optimizing for the Lighthouse Score
There is another common pitfall in web development:
turning the Lighthouse Score into a company KPI.
Achieving a 100 score feels gratifying.
However, a vanity score does not inherently deliver:
- ◆higher organic traffic;
- ◆better search rankings;
- ◆improved conversion rates;
- ◆stronger customer retention;
- ◆seamless interface usability;
- ◆reduced checkout bounce rates.
In fact, development teams frequently waste weeks chasing the final points of a synthetic audit while ignoring real bottlenecks degrading their actual users' sessions.
The primary objective must always be:
improve the real user experience, not create a perfect screenshot.
Lighthouse is a vehicle to help you get there.
It is never the destination.
RUM Implementation Checklist
When architecting a first-party RUM system, consider this baseline blueprint:
Core Metrics
- ◆LCP (Largest Contentful Paint)
- ◆INP (Interaction to Next Paint)
- ◆CLS (Cumulative Layout Shift)
- ◆FCP (First Contentful Paint)
- ◆TTFB (Time to First Byte)
Segmentation
- ◆Device Category (Mobile / Tablet / Desktop)
- ◆Browser & Rendering Engine
- ◆Operating System
- ◆Country & Geographic Region
- ◆Canonical URL
- ◆Template Type (Home, Category, PDP, Article)
- ◆Frontend Application Release & Build ID
Diagnostics & Attribution
- ◆Target DOM element for LCP
- ◆Problematic interaction and selector path for INP
- ◆Cumulative shift sources for CLS
- ◆Accompanying scripts and third-party libraries
- ◆Long Tasks exceeding 50ms on the Main Thread
Continuous Monitoring
- ◆P75 benchmark tracking
- ◆Time-series trends and rolling averages
- ◆Automated regression alerts
- ◆Pre/post-deployment delta analysis
- ◆Strict segmentation by device profile
Search & Business Alignment
- ◆Benchmark internal RUM telemetry against CrUX datasets
- ◆Correlate with Google Search Console reports
- ◆Monitor business KPIs alongside technical improvements
- ◆Remember Core Web Vitals represents a foundational quality bar, not the entire ranking algorithm
Don't Abandon Lighthouse—Abandon the Myth That It Represents Everyone
Lighthouse remains an essential, indispensable development tool.
The problem has never been Lighthouse.
The problem is using synthetic lab data to answer questions about real human beings.
A mature web performance strategy operates across three coordinated tiers:
- ◆🔬 Lighthouse: Experiment, isolate regressions, and validate optimizations in a clean, reproducible lab environment.
- ◆👥 RUM: Observe what real visitors experience in production, segmenting performance across hardware, geography, templates, and interactions.
- ◆🔎 CrUX: Understand the aggregated field benchmark that Google's algorithms utilize to evaluate your Core Web Vitals.
Unifying all three sources creates a far more resilient engineering foundation than relying on any single tool in isolation.
A website does not live inside a synthetic Lighthouse container.
It lives on the screens and hardware of your actual audience.
If your goal is to elevate SEO rankings, user satisfaction, and business conversions, your primary question should never be:
“What score did we get on Lighthouse?”
It should always be:
“What experience are our real users having, and where is it falling short?”
That is the pivotal moment where RUM transcends performance engineering and becomes a competitive strategic advantage for your product and business.
References & Further Reading
- ◆Google Search Central — Core Web Vitals and Page Experience: Official documentation on LCP, INP, CLS, and their role in Google Search results.
- ◆web.dev — Web Vitals: Field methodology, P75 thresholds, and the distinction between synthetic lab tools and field datasets.
- ◆web.dev — How to Measure Web Vitals: Practical guidance on lab vs. RUM implementations, specifically addressing CLS and INP.
- ◆GoogleChrome/web-vitals: Official JavaScript library for capturing Web Vitals with real user attribution data.
- ◆RUMvision — Lighthouse, Core Web Vitals, and RUM: Deep dive into synthetic simulations, CrUX, and live user observability.
- ◆DebugBear — CrUX vs. RUM: Comprehensive breakdown of data coverage, telemetry granularity, update frequencies, and root-cause debugging.
Need to Audit Real-World Performance or Implement RUM on Your Site?
If your website boasts high Lighthouse scores but still struggles with Search Console warnings, conversion drops, or sluggish interactions on mobile devices, auditing your real-world performance is the first critical step.
Combining frontend development, web architecture, technical SEO, and performance analytics, I help businesses implement robust RUM telemetry, resolve Core Web Vitals bottlenecks, and ensure their technical stack drives measurable business growth.
📩 Reach out at contacto@martinmatias.com.ar to discuss your project.
Related Articles
Explore more curated content on SEO, Artificial Intelligence, and Web Development.

INP & Rendering in 2026: Optimize Interaction Without Harming SEO
A technical guide to understanding Interaction to Next Paint (INP), the Main Thread, Long Tasks, and the impact of JavaScript, the DOM, and third-party scripts on user experience and organic performance in 2026.

SEO-First Web Architecture: Integrating Technical SEO in UI/UX
Discover why integrating technical SEO and information architecture right from the UI/UX design phase prevents costly redesigns, improves user experience, and prepares your website for sustainable organic growth.
Have a project in mind?
I build modern, fast, and SEO-optimized web solutions. Let's talk!